最近博客更新的比较慢,因为工作比较忙所以只能抽出周末的时间写点东西了.好像除了过节还没有这么久没更新的记录,哈.
最近有一个需求是根据数据自动在前端页面画出一个流程导向图,简单说就是把数据以A节点指向B节点,B节点指向C节点这种形式给你,然后让页面自己在一定区域内渲染出一个流程图.当然节点上可能还有其他信息,这个暂时不考虑,就是这样一个需求,最后是借助一个工具完成的.先说一下处理过程:
可以说这个问题一开始我走了弯路,想的不是那么清楚,一开始想的是自己画.低端的就是用html+css各种布局,画出方块和线条,至于箭头什么的再想办法.后来一想这样太低端了,应该专业一点,就打算用canvas或者svg.因为之前用过echarts前端的图标库,知道它底层有个依赖库zrender就是专门弄canvas的,所以好一阵看,感觉还靠谱,能画出来.

这样虽然能画出来,不过接下来我们就要考虑更多的问题,首先什么时候折行,然后遇到分支的种种情况怎么处理.最后我查资料竟然开始涉及一些图论的东西了,深刻感觉到东西好像变复杂了,我的目的不是研究理论,而是为了一个实现.
这时候转变一下思路,有没有什么工具能专门做这样的工作,类似于jQuery大家都用它操作DOM,RequireJS都用它来实现模块化加载.那应该也有类似的东西,集成了数学上的图论,自动布局等.这就不得不说Github火的一塌糊涂是有原因的,我搜了很多中文网站以及百度都没什么结果(不知道是不是关键字有问题),总之没搜到能用的东西.但是在Github上找到了一个开源项目:dagre-d3.
看名字就能猜到它是基于D3库的,D3是一个专门用于前端图形绘制的库,dagre-d3就是实现自动布局并且绘制流程图的这么一个东西.
Dagre is a JavaScript library that makes it easy to lay out directed graphs on the client-side. The dagre-d3 library acts a front-end to dagre, providing actual rendering using .
上一个简单的Demo:
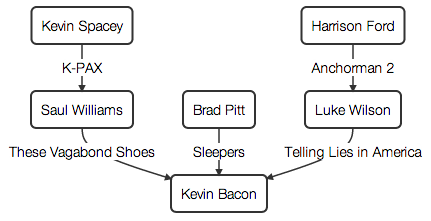
// Create a new directed graphvar g = new dagreD3.Digraph();// Add nodes to the graph. The first argument is the node id. The second is// metadata about the node. In this case we're going to add labels to each of// our nodes.g.addNode("kspacey", { label: "Kevin Spacey" });g.addNode("swilliams", { label: "Saul Williams" });g.addNode("bpitt", { label: "Brad Pitt" });g.addNode("hford", { label: "Harrison Ford" });g.addNode("lwilson", { label: "Luke Wilson" });g.addNode("kbacon", { label: "Kevin Bacon" });// Add edges to the graph. The first argument is the edge id. Here we use null// to indicate that an arbitrary edge id can be assigned automatically. The// second argument is the source of the edge. The third argument is the target// of the edge. The last argument is the edge metadata.g.addEdge(null, "kspacey", "swilliams", { label: "K-PAX" });g.addEdge(null, "swilliams", "kbacon", { label: "These Vagabond Shoes" });g.addEdge(null, "bpitt", "kbacon", { label: "Sleepers" });g.addEdge(null, "hford", "lwilson", { label: "Anchorman 2" });g.addEdge(null, "lwilson", "kbacon", { label: "Telling Lies in America" }); 它渲染出来是这样的:

这样我们只要把数据处理成对应格式,就可以轻松的自动绘制会流程图.比较给力的是它对数据的支持良好,有多个格式可以选择,而且虽然接口不多,但是对于节点以及线条的操作都有,可以很轻松的改变节点以及线条的样式,这个大家可以看官方的demo.
另外如果要附加交互事件,可以通过jquery实现,也很容易,我使用bootstrap的tooltip很轻松的就加上去了.感觉还是个很给力的库,而且国内这方面资料感觉不多,分享给大家.
最后差点忘了Github地址: